Dashboard word officially originated in the automobile industry and is later used in the IT industry. Like many other things, dashboards are adopted in the IT industry for a real-life reason – simplifying the data.
They basically help us get the complete information in a simplified way. Just like the dashboard of a car, it gives lots of information in one place.
In this blog, we will cover all your queries regarding this intriguing dashboard technology.
So let us begin!
What Are Dashboards?

A dashboard is a graphic representation of the summary from the reports of various departments. As we can perceive, this technology has been there in the automobile industry as a machinery part for a long time.
The first and foremost purpose of the dashboard is to express the real-time events as data visuals by extracting the data from different units, all in one window – do not have to scroll down or up.
For example, let us take the example of an automobile dashboard. Of course, they make things easier! You can tell the amount of fuel you have left in your vehicle; only by looking at a dial. Also, there is another meter that calculates speed. Some advanced automobiles also have an alert system that warns the driver regarding the issues in the engine.
With a wide range of abilities, digital dashboard technology is paving the way for easy work and decision-making practice in the IT world. The basic definition is the same for every one of them, whether it is digital or analog.
Let us dive into the different types of the dashboard you can possibly experience in the tech sphere.
Types Of Dashboards For Different Businesses
Well, dashboards have an infinite number of possible types. But it is up to the purpose and the usage of the thi technology by the company or an individual. However, every average dashboard falls under three functions, or you can say three grounds.
According to idashboards.com, there are three basic types of user dashboard.
- Operational
- Analytical
- Strategic
Operational Dashboard
Every business needs a dashboard that can monitor and evaluate day-to-day operations within the company. Such data helps to make informed dialogues, improve performances, and better departmental data representation.
An operational dashboard is a common type of dashboard available in the market. These dashboard technologies can be favorable for any industry, whether employee monitoring, logistics, user activity data dashboard in a social media platform, manufacturing, or marketing. An operational dashboard focuses on displaying the difference in the current data from previous data.
Operational dashboards data usually help companies stay informed, proactive, and alerted for any problems. Because of their elaborated nature, they are most likely to get used to tracking the particular activity or project in the company. Their operational reports are more detailed and specific to the projects. That is why they are considered best in the areas of employee monitoring and data security professions.
Analytical Dashboard
An analytical dashboard is all about analyzing and comparing given data to predict and identify the prospects. They apply to every business model of every industry, whether it is finance performance, health analytics, retail KPI, or FMCG business. An analytical dashboard focuses on predicting the effects of the particular activity that is happening currently.
Analytical dashboard aims to gather all sorts of information regarding the industry and the current procedures in the company to handle the ongoing activity. The dashboard of such extentions gain an audience from the analysts who have to study the data and present the final report to their executives.
An analytical dashboards give a full overview of the current data sets and forecasts the trends, prospects, multiple variables, and targets. This data can be implemented to have business intelligence insights. They are used to analyze very complex data forms. In real life, an analytical dashboard can come with the infusion of operational dashboard technology.
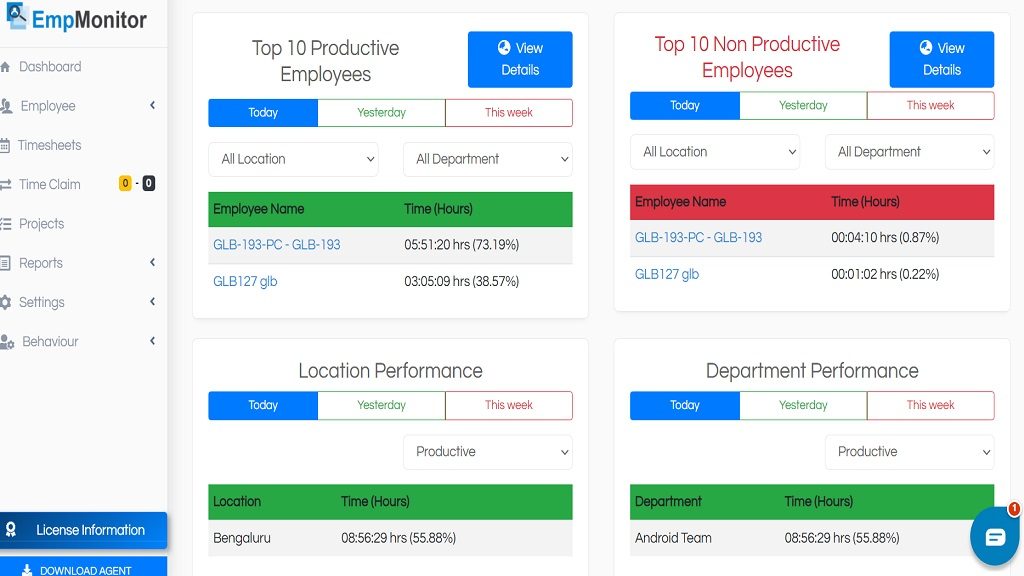
EmpMonitor is also an analytical dashboard. Let us have a peak into its dashboard.
Strategic Dashboard
A strategic dashboard helps track the performances of data sets to assist the superior level management get a complete overview of every section of the company. These are industry-level dashboard technologies that deal with very complex data that can impact businesses on an enterprise-wide level.
As the name suggests, a strategic dashboard is here for strategic goals. They perform on a specified aim, and as a result, they tend to summarize the period of performance into time frames or productivity frames. They represent dashboards data in the form of any functional aspect that works for the company.
Usually, the strategic dashboard gets used for tracking matrices of services, company, revenue collection, project status, success ratios, performance metrics, productivity overviews, industry trends, competitive insights, and more. One can assume they are more of a Saas product.
Why Dashboards Are Important
Data handling is a crucial matter for any organization. Whether it is the IT industry or government, every sector of work needs to have a grip over its data. Well, the dashboard is not an ancient concept. Human beings have been keeping records of their data for a long time.
Dashboards play a vital role in decision-making and help organizations keep a check on their performance. They provide a bird’ eye view of the organization and give out-of-the-box solutions to improve organizational performance.
This technology is crucial for doing analytics in business. A mere presence of a basic dashboard is capable of making data processing easier for a person at that particular time.
Not to mention, user dashboards make certain to save time and effort for the person. However, complex dashboard technologies do require a little effort to decipher the information to prepare reports, but they do all the initial work done in no time.
Benefits Of A Dashboard In Business
Any dashboard has only one purpose to fulfill – simplify things for humans. Whether it is an analog or a digital one, they make data easier to process and help companies perform better in this cut-throat competitive world.
Here are the top ten benefits of this dashboard technology you can simply feel grateful for.
- Easier Data Processing:
It is easier to process simpler data than complex ones. Even a basic dashboard helps us to absorb the current data of high priority out of all the numerous data of all times. It only shows us the real-time data so that we can make decisions as suited to the situation. Overall, it shows us the current status of the activity performed.
- Saving Time:
Time is the most valuable asset when you are in the middle of constant competition and workload pressure. It is not easier for a human to process piles and piles of data from the record and make a conclusive dialogue. Therefore, to tackle that issue, dashboards were invented. The most innovative service you can ask for! They help you process loads of data in a matter of seconds. Performance management dashboards are especially crucial in this regard. They offer a consolidated view of key performance indicators, allowing users to track progress, identify trends, and make informed decisions swiftly.
- Better Decision Making:
Quick decision-making is a crucial aspect if you are here to grow as fast as you can. These trends and technologies keep changing in a matter of a short while.
With such a rush, you cannot afford to lose time to make one easy decision. So Dashboards help you with quick decision making and also better.
Now, it is easier to process the data and make quality decisions within a concerned time limit.
- Prevent from the extra effort:
Extra effort is dangerous.
The know-how of the ways to do smart work helps you stay effective in the long run. And also in providing better results. Manually arranging the data reports is worth hours of work. The dashboard works in a way that assists you to cut short the time in minutes during analyzing the data.
- Accountability:
It is always good to know that you are doing things right. But where you have gone wrong is a million-dollar question. A Dashboard allows you to perceive the areas of issues to make improvements faster before being any minute late.
- Easy Access To Processed Data:
Processing data is one thing and having access to them is another. Consuming and differentiating data will not be an issue because the dashboard is only one or two-page windows. And present the summarized information of every concerned department over a limited window frame.
- Complex Data – Simpler Visibility:
The beauty of any dashboard is, no matter how complex data is, it will show it to you in the simplest way possible. That is why all dashboards report the real-time data of your desired category.
- Customize Representation Of The Dashboard Data:
The dashboards have a feature that allows the admin to decide which data should be visible to whom. Also, they can customize their data which suits them best. No one has to know all of the data. Only priority ones will be there in the display.
- Excellent Surveillance On Data:
It is not easy for a human mind to keep an eye on every possible piece of data and record them. However, artificial intelligence can record everything without fail. AI is the bigger word. Simple programming also helps to keep detailed records of everything. Dashboards are here to do that. They keep track of every activity and interaction so that a concerned authority can have informed decisions.
- Easier To Locate Details:
A dashboard records everything and presents them in a simplified way. This way, it is easier to locate data that can miss if not paid attention to. They have a sophisticated layout that can compile every possible detail.
Conclusion
Dashboards are a unique tool to obtain summarized data on one page.
The concept of a dashboard is quite simple. They basically help us to get the complete information in a simplified way.
And, with the use of graphs and charts, the dashboard shows the volatility of data, or simply put, how much data there is at that time. But, for every reason, they make life easier by simplifying data processing and management.