The navigation of the day-to-day running business challenges is overwhelming. With so many moving parts tracking everything that matters is hard at times. That’s where executive dashboards step in.
They’re like your business’s control center, giving you a clear view of essential data and metrics without getting lost. Instead of sifting through endless reports, you get a quick, visual summary that helps you make smarter decisions faster.
In this blog, we’ll examine how these dashboards can simplify your life and keep your business on track.
In a hurry? Listen to the blog instead!
What Are Executive Dashboards?
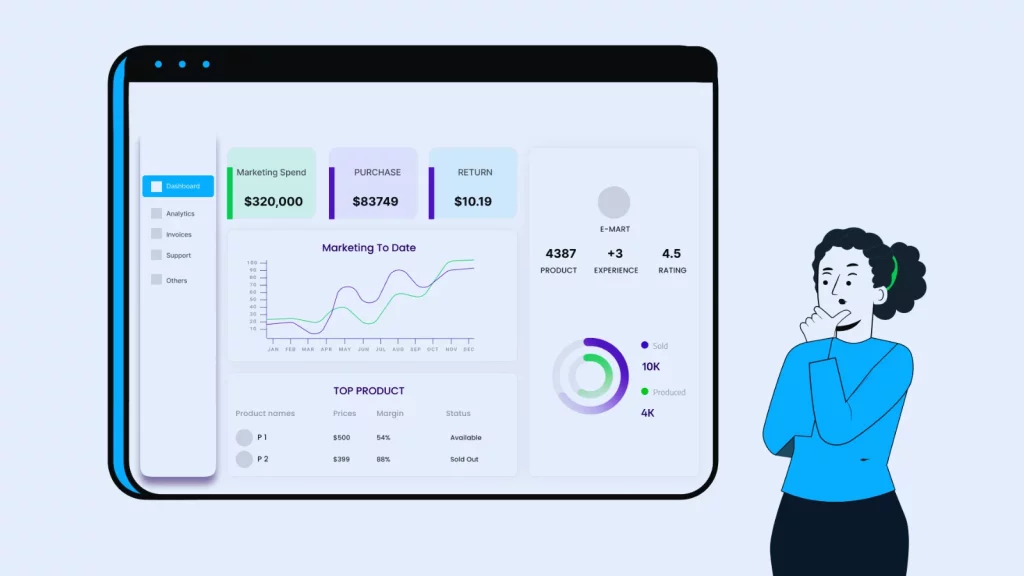
An executive dashboard is a visual tool that showcases vital business performance metrics. By pulling data from multiple sources and presenting it in straightforward charts and graphs, these dashboards enable top executives to comprehend the most essential information.
These dashboards aim to present the most pertinent information from your organization in the shortest time possible. Dashboards offer an overview of key performance indicators (KPIs) spanning various business areas, such as workforce intelligence and change management. They provide the real-time insights necessary to make informed decisions, enhancing your effectiveness as an executive.
These dashboards provide:
- A user-friendly graphical interface
- Customizable metrics tailored to your specific needs
- Integrated data from various sources and departments
- A design that ensures quick access to up-to-date information
Why Use An Executive Dashboard?
Executive dashboards offer numerous advantages, regardless of your management role. They’re customizable and give you a top-level view of various departments, from sales to customer relations.
Here’s why they’re so beneficial:
Enhance Team Performance
By showing team members how their work supports overall goals an executive dashboard can boost motivation and productivity. They’re more likely to stay engaged and work harder when they see their progress and understand their impact.
Gain New Insights
The benefit of an executive dashboard is the new insights it provides. It helps you dig deeper into data and make decisions based on solid facts. Without it, piecing together a company’s data to see the big picture can be challenging.
Save Time
Having all the necessary information in one place can significantly speed up decision-making, particularly in today’s fast-paced work environments. Studies show that knowledge workers often spend 60% of their time on tasks like searching for data and switching between multiple tools, which impacts productivity.
Advanced workforce management software, such as EmpMonitor, addresses this issue by consolidating crucial information into centralized executive dashboards. This feature minimizes the time spent on routine data management, allowing you to access all relevant details with a single click and make informed decisions faster.
Track Project Success
An executive dashboard helps you monitor project success by displaying key performance metrics. By customizing your KPIs, you can easily view a project’s history, current status, and future projections all in one place.
Spot Opportunities for Improvement
As a project manager, the goal is to improve team processes and leadership strategies. An executive dashboard offers a comprehensive view of team and project performance management, helping you identify and address any issues promptly.
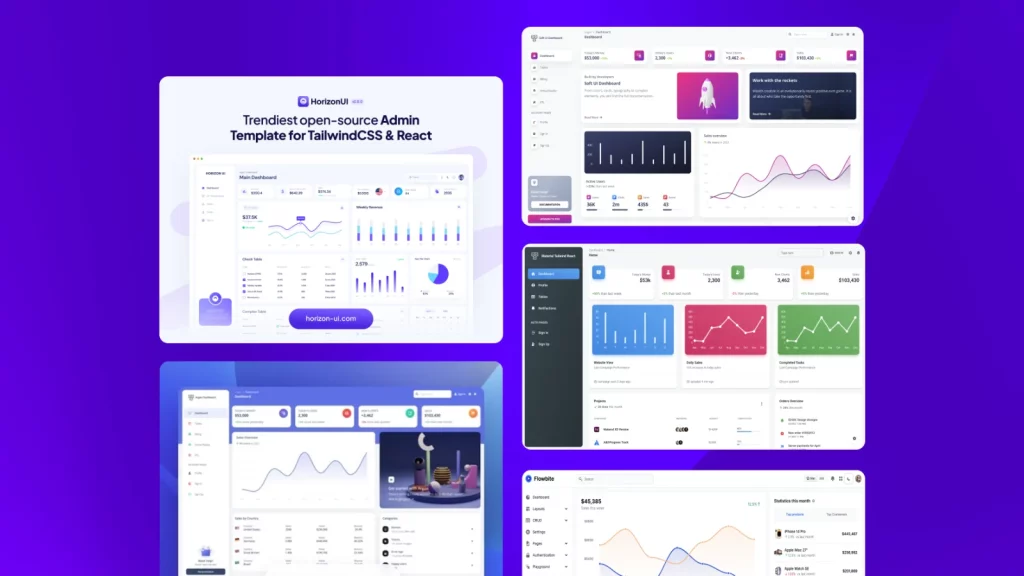
5+ Must-Know Dashboards for Better Business Insights
When understanding different aspects of your business, there’s a dashboard tailored for virtually every need—from project management and finance to sales and beyond. While these executive dashboards provide valuable insights into daily operations, they might not give you a larger picture of employee productivity and performance.
To get a comprehensive view, consider these essential types of dashboards that can enhance your decision-making with data-driven insights:
Productivity Dashboard
Productivity dash or dashboards consolidate various metrics, such as time spent on tasks and app usage, to gauge how activities align with company goals. They help you understand the habits of top performers and identify ways to support your team in reaching their full potential.
Location Insights Dashboard
This dashboard reveals whether employees are more productive working in-office, remotely, or in a hybrid setup. It illuminates where employees work best, helping you make informed decisions about workplace policies and office space.
Technology Usage Dashboard
Monitor which applications and websites your teams use most frequently. Checking regularly can help ensure that work activities align with roles and identify unused software subscriptions.
Workload Management Dashboard
Managing workloads effectively is a key leadership challenge. These executive dashboards help you see who is at capacity and who can take on more tasks. Use it daily to balance workloads and prevent employee burnout by spotting signs of overwork early.
Benchmarks Dashboard
Set and track performance benchmarks with this dashboard, which quantifies typical productivity levels and sets realistic expectations for your teams. It helps you push for improvements without overburdening your staff.
Headcount Planning Dashboard
Determine whether your teams need more support or if you should redistribute work to optimize labor costs with this dashboard. It helps you assess available capacity and avoid overspending on additional hires.
Organization Overview Dashboard
Organization overview executive dashboards provide a comprehensive overview of essential productivity metrics across teams. It highlights workload imbalances and tracks progress toward daily productivity goals.
Team Management Dashboard
Tracking team availability and activity, including engagement and capacity, helps you understand how effectively your team is working. With tools like EmpMonitor, you can assess progress and analyze productivity trends over time, helping you make informed decisions.
By leveraging tools like EmpMonitor- a workforce management software, you gain valuable insights into team performance, allowing for more effective workload management and strategic alignment with organizational objectives.
These dashboards are essential for making informed, data-driven decisions and optimizing the dimensions of your business operations.
EmpMonitor- Workforce Management Software
EmpMonitor is a powerful workforce management and productivity tool that provides comprehensive insights into employee performance and engagement. Here’s an overview of its key features and benefits:
1. Real-Time Monitoring
EmpMonitor offers real-time tracking of employee activities, enabling managers to stay updated on productivity and engagement levels. This feature helps you quickly spot problems and make modish decisions.
2. Detailed Analytics
With its advanced analytics capabilities, EmpMonitor provides in-depth reports on various metrics such as time spent on tasks, application usage, and overall productivity. These insights help understand how different activities contribute to organizational goals and can be integrated into executive dashboards for a comprehensive view.
3. Productivity Tracking
EmpMonitor tracks productivity trends over time, allowing you to compare current performance with historical data. This feature is crucial for identifying patterns, measuring progress, and implementing strategies for improvement.
4. Workload Management
EmpMonitor- an employee monitoring software helps manage workloads by providing visibility into each team member’s capacity and engagement levels. It ensures that workloads are balanced effectively, preventing burnout and optimizing resource allocation.
5. Customizable Dashboards
The tool offers customizable dashboards that allow you to display the most relevant metrics and data for your organization. This personalization ensures that the information you see aligns with your specific management needs and goals.
EmpMonitor’s robust feature set makes it an essential tool for optimizing workforce management, enhancing productivity, and achieving organizational goals.
How To Create Executive Dashboards?
You can use these tips to create an executive dashboard that aligns with your team’s needs. Understanding what information to show and how to present it is crucial for developing a dashboard that enhances your leadership.
Identify Your Audience
Your executive dashboard should cater to a specific audience within your organization. For instance, if you’re a project manager, focus on metrics relevant to your projects and team members. Start by determining who will use the dashboard and what information will be most valuable to them. Answer these questions to clarify your audience’s needs:
- What are my team’s goals?
- How can I measure my team’s performance?
- What data do I need to improve our team or company?
- What data will help me be a better leader?
By identifying your audience and answering these questions, you can define the success metrics for your executive dashboards.
Define Your KPIs
Key Performance Indicators (KPIs) are the metrics displayed on your executive dashboard. You can choose to present these as graphs, tables, or charts, but they should always serve the needs of your identified audience. For example, if you’re managing a marketing team, a goal might be to produce 10 pieces of content per month across different channels. Your KPIs could include:
- Completed projects by channel
- Incomplete projects by channel and assigned team member
- Unassigned projects by channel and priority
- A chart showing progress toward the goal
Include other KPIs that provide a high-level view of your team’s and the company’s strategic goals, such as team member performance or overall marketing success.
Customize Your Dashboard
Beyond the data itself, the visual presentation is essential. Ensure the executive dashboards are designed for an optimal user experience, making information easy to understand. The design will vary based on your business activities. For example, a data analytics dashboard might need to display large amounts of data effectively to spot trends.
Make Sure Your Data Tells a Story
Your dashboard should present data in a way that tells a coherent story. Simply having data is disadvantageous if it’s not clear or actionable. For the content production example, your dashboard should help answer questions like:
- How many projects has your team completed for each marketing channel?
- How many projects are still in progress, and which channels do they concern to?
- How are we prioritizing unfinished projects?
- Who is responsible for completing them?
- How close are we to reaching our goal?
Your dashboard should enable users to answer these questions effortlessly.
Use a Reporting Tool
Use a reporting tool to automate and update your executive dashboards with real-time data. Some tools specialize in specific areas like SEO or website traffic, while universal reporting tools aggregate diverse data types into a unified report. With universal reporting dashboard software, you can create a comprehensive management dashboard to track progress across your organization.
Best Practices For Executive Dashboard
Executive dashboard simplifies your role, but following a few best practices can help you maximize their effectiveness.
- Customize Your Display: Select three to five key metrics and tailor your dashboard to highlight these prominently. By focusing on specific data, you can avoid clutter and ensure crucial insights stand out.
- Keep It Simple: Whether you opt for a pre-made solution or build a custom dashboard, prioritize simplicity. Avoid unnecessary features and focus on presenting clear, straightforward information in easy-to-read visuals.
- Automate Updates: Set up automated email reports or schedule regular reminders to review executive dashboards weekly or monthly. This habit will help you stay updated on vital changes and maintain consistent oversight.
Read More
Dashboards: Types, Benefits, And Importance In 2022
Navigate Success: The Ultimate Guide To Performance Management Dashboard
7 Signs A Standard Reporting Dashboard Won’t Cut It
While the dashboards mentioned earlier are great for visualizing and analyzing large data sets, they only offer a snapshot from a single moment. You will require something more robust for a deeper, more actionable understanding, especially in management roles. If you find yourself in any of the following situations, a basic reporting dashboard may not be enough—you’ll need a strategic dashboard to meet your needs:
You Need Management Insight
Dashboards excel at presenting data visually, but they can’t always reveal the underlying reasons behind the numbers. Advanced workforce management software, like EmpMonitor, helps bridge this gap by offering deeper insights into workforce activity and performance. Great managers can leverage these insights to understand the broader context, interpret missed goals, and take corrective actions effectively.
You Need an Early Warning System
Executive Dashboards show current data, but to anticipate future issues, you need leading indicators that predict problems before they arise. Combining leading and lagging indicators helps you foresee potential challenges and plan accordingly.
You Need Context
Real-time data alone isn’t enough. You need to understand historical trends and previous actions to make sense of current performance. Contextual tools and historical data help you address recurring issues and evaluate the impact of past decisions.
You’re Looking at Wide Data
While dashboards can slice and present data in various ways, they might not integrate information across the entire organization. In order to get a comprehensive view of your business, you need to connect data from different departments and sources.
You Need to See Action Items
Executive Dashboards do not capture action items or follow-ups from meetings. To ensure commitments are tracked and completed, you require integrating a project management dashboard to keep track of action items and progress.
You Need Strategic Linkage
Dashboards focus on operational metrics, but strategic goals require long-term tracking. You must align day-to-day metrics with your broader strategic objectives to ensure track to meet long-term goals.
You Need Organizational and Project Alignment
A dashboard alone can’t show how well your projects and budgets align with strategic goals. For effective goal setting and execution, you must ensure that projects are on track, within budget, and aligned with your overall strategy.
While dashboards are useful for real-time data and visualization, strategic dashboards offer the deeper insights and broader context necessary for effective management and long-term planning.
Wrapping Up
Having reliable executive dashboards is more than just a convenience—it’s a necessity. These dashboards offer a powerful way to consolidate and visualize essential data, enabling you to make informed decisions quickly. These dashboards show you essential numbers clearly, helping you keep track of your goals, handle risks better, and lead your team confidently.
To enhance your executive dashboard experience, consider integrating tools like EmpMonitor. EmpMonitor offers advanced features for tracking employee productivity, managing workloads, and analyzing performance metrics. Its real-time insights and comprehensive data integration can complement your dashboard, providing a deeper understanding of your team’s dynamics and organizational health.
As you implement or refine your executive dashboards, focus on simplicity, relevance, and real-time updates. Customize your dashboard to display the most crucial metrics, ensure it provides actionable insights, and leverage it to drive strategic decisions. With the right tools and approach, you can turn your executive dashboard into a powerful asset that guides your organization toward success with clarity and precision.
Frequently Asked Questions
Que: What Makes A Dashboard Successful?
Successful dashboards are clear, interactive, and easy to use. They present information in a way that allows users to grasp key insights quickly. These dashboards help users spot trends, identify patterns, and find areas for improvement through a straightforward and engaging data analysis process.
Que: When to Use an Executive Dashboard?
Executive dashboards are essential for quickly summarizing critical data, enabling your team to make informed, data-driven decisions. In addition to incorporating executive dashboards into regular strategy meetings, it is crucial to use them whenever specific metrics are threatened or require close monitoring.
Que: How to Improve Your KPI Dashboard?
- Select the Right KPIs: Display the most relevant KPIs to your goals and objectives.
- Organize Information by Relevance: Arrange data in a way that highlights what’s most important first.
- Avoid Clutter: Keep the dashboard clean and focused to prevent information overload.
- Enable Interactivity: Add interactive features so users can explore data in more depth.
- Ensure Actionability: Design the dashboard to help users make informed decisions and take action.
- Provide Context: Offer explanations or narratives to help interpret the data.
- Optimize Legends and Labels: Ensure legends are clear and placed in an accessible location.
- Test Scaling Options: Evaluate how different scaling methods impact data visibility and usability.

