A few months ago, a customer experience manager approached us with a challenge that was difficult to pinpoint. She managed a remote support team of 17 agents working across two shifts.
On paper, everything appeared to be running smoothly. SLA reports showed a 76 percent compliance rate, tickets were consistently being picked up, and response times were logged within the expected window.
However, underlying issues were beginning to surface. Customer renewal rates were declining, support-related complaints were appearing in exit interviews, and the manager increasingly felt that the SLA numbers she reviewed each morning were not telling the complete story.
As it turned out, her instincts were correct.

The Ticket That Should Have Taken Ten Minutes
One case made the problem concrete.
A customer submitted a billing issue marked urgent. An agent picked it up within the required response window. The SLA clock stopped. Compliance box ticked.
Then nothing happened for over four hours.
When the issue wasn’t resolved, the customer contacted support again. Eventually, the ticket had to be escalated to a senior agent. By the time it was finally resolved, the experience had already damaged the relationship. The customer cancelled their subscription the following month and mentioned the support interaction in their exit survey.
The SLA performance dashboard showed green the entire time.
This was not a case of obvious wrongdoing. The agent had responded, technically. But the response was a one-line acknowledgment that stopped the clock without starting the work.
The metric looked fine. The customer experience was not.
The Numbers Were Right. The Picture Was Wrong.
Eight weeks of data told her the team was responding on time. What it did not tell her was what happened next.
A customer submits an issue. An agent replies within minutes. From the outside, it looks like a team doing its job. From the customer’s side, it often meant waiting hours for any real progress after that first message. The acknowledgement had arrived. The help did not.
Leadership metrics and customer experience had quietly drifted apart.
Escalation rates were rising because customers were not getting resolution, even after being told someone was on it. Satisfaction scores were falling for the same reason. The team was technically compliant and practically falling short.
She had a platform that tracked every ticket. What she needed was something that could show her what was happening on the other side of the screen.
Why the Helpdesk Dashboard Was Not Enough

The existing helpdesk software was doing its job. That is worth saying clearly.
It tracked ticket creation, assignment, and status changes accurately. It measured first response time and generated technically correct compliance reports.
The problem was that it could only see what happened at the ticket level. It had no view into the person behind the ticket.
It could not show whether an agent was actively working or sitting idle between responses. It could not tell her whether an acknowledgment reply was the beginning of real engagement or just a clock-stopping move.
The data existed at the system level. It did not exist at the human level.
That was the gap she needed to close.
They Brought EmpMonitor In

Rather than rolling it out immediately, the manager started with a single shift of eight agents. The group was deliberately mixed. Every agent was told upfront. The purpose was clear: to understand how workload was actually being distributed, not to build a case against anyone.
EmpMonitor ran for two weeks. Several features stood out as directly relevant to SLA performance in a support environment.
Activity and idle time tracking showed how much of each shift was spent in genuine active engagement versus inactivity. An agent appearing available could now be distinguished from one actually working.
Real-time screenshot monitoring provided timestamped snapshots throughout the shift, giving the manager an honest picture of what a working hour actually looked like across the team.
Application and URL tracking revealed how much time was spent inside the helpdesk platform versus personal browsing or non-work activity.
Shift and attendance reports surfaced patterns that had gone unnoticed: late logins, early wind-downs, and extended breaks not reflected on time sheets.
Within 72 hours, she had more genuine insight into her team’s daily habits than months of SLA performance reports had ever provided.
What the Data Revealed
The results were uncomfortable in places and clarifying in others.
Across the pilot group, agents were averaging just under two hours of genuine active engagement per shift outside of response windows. The rest was idle time, personal browsing, and low-effort activity.
The acknowledgment pattern was confirmed. Screenshots showed agents sending brief replies within minutes of pickup, then switching to unrelated tabs. The SLA clock had stopped. The work had not started.
Two agents stood out for the opposite reason. Consistently high active time, strong resolution quality, and the best customer satisfaction scores on the team. Their behavior became the internal benchmark.
The conversation with the broader group was calm and factual. No confrontation was needed because the data spoke clearly. Expectations were restated and backed by concrete examples. Within ten days, the clock-stopping behavior had largely disappeared.
The 33% Turnaround
The full rollout took a month. The results came faster than that.
Within 45 days, SLA breach rates had dropped by 33 percent and overall compliance had climbed from 76 to 91 percent. The resolution times and escalation rates that had been quietly worsening for months both improved.
The manager had expected the numbers to move. What she had not fully anticipated was the shift in the team itself.
The clock-stopping behavior faded not because agents were told to stop but because the environment had changed. When people know their work is genuinely visible, the incentive to game the surface disappears. Agents started treating acknowledgment replies as the beginning of the work rather than the end of their obligation.
For the first time, the team the manager saw in her SLA performance reports and the team her customers were experiencing felt like the same one.
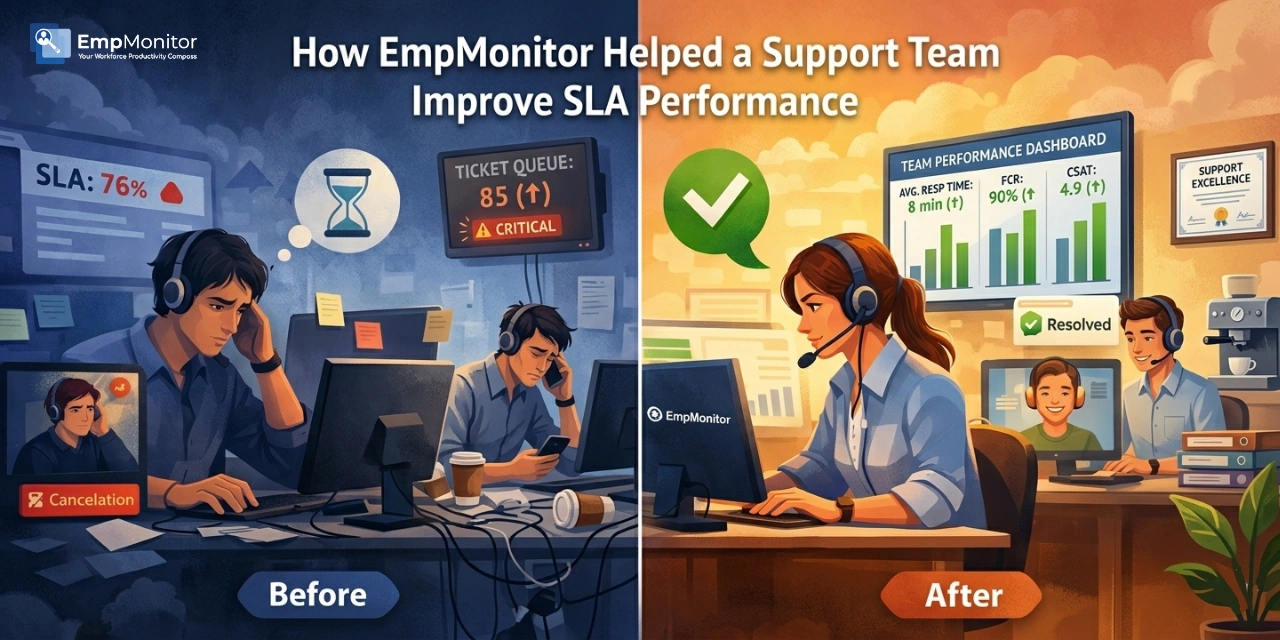
Before vs After Implementing EmpMonitor

Before EmpMonitor, SLA performance visibility was limited to ticket timestamps with no view into agent activity between interactions. Quick acknowledgment replies were stopping the compliance clock without starting real work. Idle time went undetected. The 76 percent compliance rate masked weak resolution quality underneath. Escalation rates were climbing, and the manager was making decisions based on an incomplete picture.
After EmpMonitor, genuine engagement became trackable alongside response time. Idle periods were logged. Agent activity between tickets was visible through screenshots and application data. SLA performance compliance rose to 91 percent, backed by real resolution outcomes. The breach rate dropped 33 percent within 45 days, and customer satisfaction scores followed.
Also Read!
What This Is Not About
She was not building a surveillance operation. She was responsible for a team, customer commitments, and a business that depended on both.
Agents who were already performing well noticed little change, except their work was now accurately reflected in data. Those who had drifted into low-effort patterns had a clear opportunity to reset. Most did.
The issue was rarely about intention. It was about a system that had let the bad habits develop because nothing was making them visible.
EmpMonitor did not create accountability. It made accountability possible.
The Bottom Line
SLA performance problems in remote support teams rarely announce themselves.
They appear as compliance rates that are technically correct and practically misleading. They live in the gap between what a timestamp records and what an agent actually does. When those gaps repeat across weeks and months, the damage to customer relationships becomes real even when the reports never flag it.
The right monitoring tool does not replace trust. It gives trust something solid to stand on.
If your SLA performance metrics look fine but customer feedback tells a different story, it may be worth looking more closely at what is happening between the timestamps.
EmpMonitor could be a good place to begin.
FAQ
-
What does SLA performance mean for remote support teams?
SLA performance measures whether a team is meeting agreed service commitments around response and resolution times. For remote teams, it matters because managers have limited visibility into how agents work. When SLA performance data is the primary measure, behaviors like clock-stopping acknowledgments can make a team appear compliant while customer experience quietly deteriorates.
-
How does EmpMonitor help improve SLA performance?
EmpMonitor adds visibility that helpdesk software cannot provide. Screenshot monitoring, application tracking, idle time detection, and productivity reports show managers what agents are doing between ticket interactions, making patterns that hurt SLA performance visible before they become entrenched.
-
Will monitoring affect morale in a support team?
Not when introduced transparently. When agents understand what is tracked and why, monitoring tends to improve fairness. Strong performers find their work finally visible in data. Those with low-effort habits have room to course-correct. The goal is an environment where output is recognized accurately.
-
Is EmpMonitor suited for shift-based remote support teams?
Yes. Shift and attendance tracking logs actual login and logout times against scheduled hours, making coverage gaps visible without relying on self-reporting. Productivity reports allow managers to compare engagement across shifts and catch patterns that standard performance data would never surface.